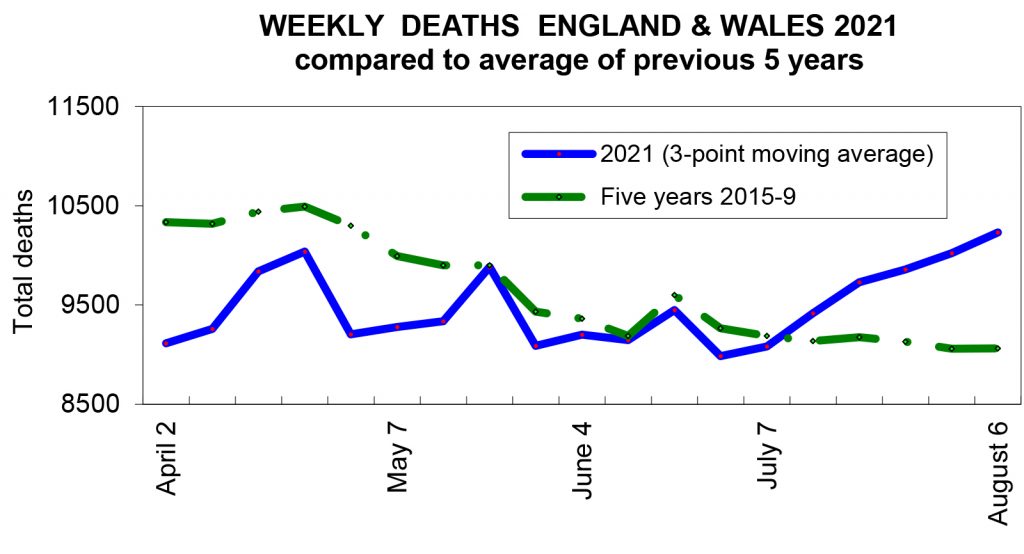
Here are total weekly deaths for England and Wales as given by the Office of National Statistics. Since mid-July this figure has mysteriously soared above the normal count with the start of August showing a thousand excess deaths per week (that’s the blue line – a trend value with each point as the average of three weeks). Average weekly-deaths for this time of year is around 9,500. The ONS helpfully gives an average value over a previous five years, 2015-9 (here shown in green) and we see how this reaches a minimum in the pleasant month of August.
We see how in the early part of the year deaths were way below the seasonal trend. That’s because the previous year saw massive extra deaths of old and infirm people, caused by the government lockdowns which terrorised them and stressed them out, also despair killed a lot of people with bankruptcies etc. There was a second lockdown period November 2020 to January 2021 which caused another huge peak in mortality. For that reason, there were a lot less deaths in the spring of 2021, as this graph shows.
As is reported in today’s newspapers (25 August) of the weekly total ending August 13: ‘That is 14% above the five-year average, or 1,270 ‘excess deaths.’ We’re being told that the excess is due to some ‘Delta variant’ of Covid, but I suggest this is not the case.
What we are seeing here is surely the effect of the the mass vaccination program. Is it indeed a bioweapon? Let us keep a close eye on this trendline over the coming Autumn and Winter.
Clearly, we’d all like to have these death figures separated by Vaxxed / Un-Vaxxed – and clearly, nobody is about to give us that! This looks like being the slow-motion knockout effect from the mRNA spike-protein cocktail, that people have been so keen to take.
