Skip to posts
The Office of National Statistics provides total weekly deaths in England and Wales. We previously looked at the 5% DROP in overall deaths since the CV scare started in mid-January. Those making the decision on the Spring Equinox to lock down Britain, would have seen these figures.
The ONS provides weekly average values using the previous five years’ data, that is how the comparison is made.
Just below these weekly figures, there are what the ONS calls “deaths where the underlying cause was respiratory disease” and let’s do exactly the same for these figures –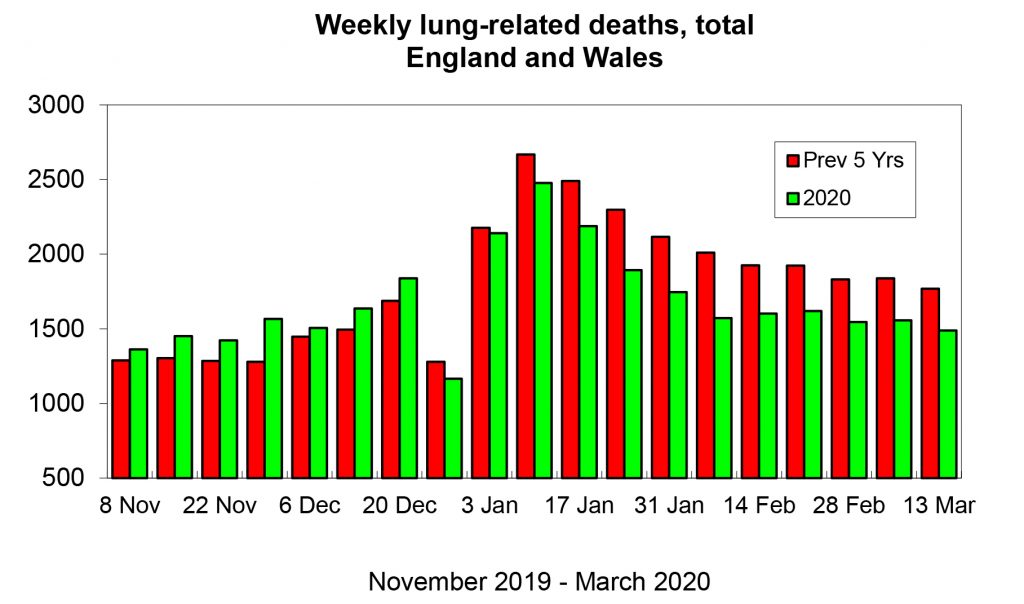 Compare this with the graph we did last week for total deaths – you can see its a much LARGER effect. For mid-January onwards all lung-related deaths were seventeen percent less than a five-year average for the same week. That is a three times larger effect than for total mortality!
Some mystery force has been preventing Brits from dying of pneumonia etc. this year, what could it be?
Well, put it this way: that’s all you need to know really. THERE IS NO PANDEMIC. No need to struggle to remember all that stuff about DNA and RNA you learnt at school. It’s not happening.
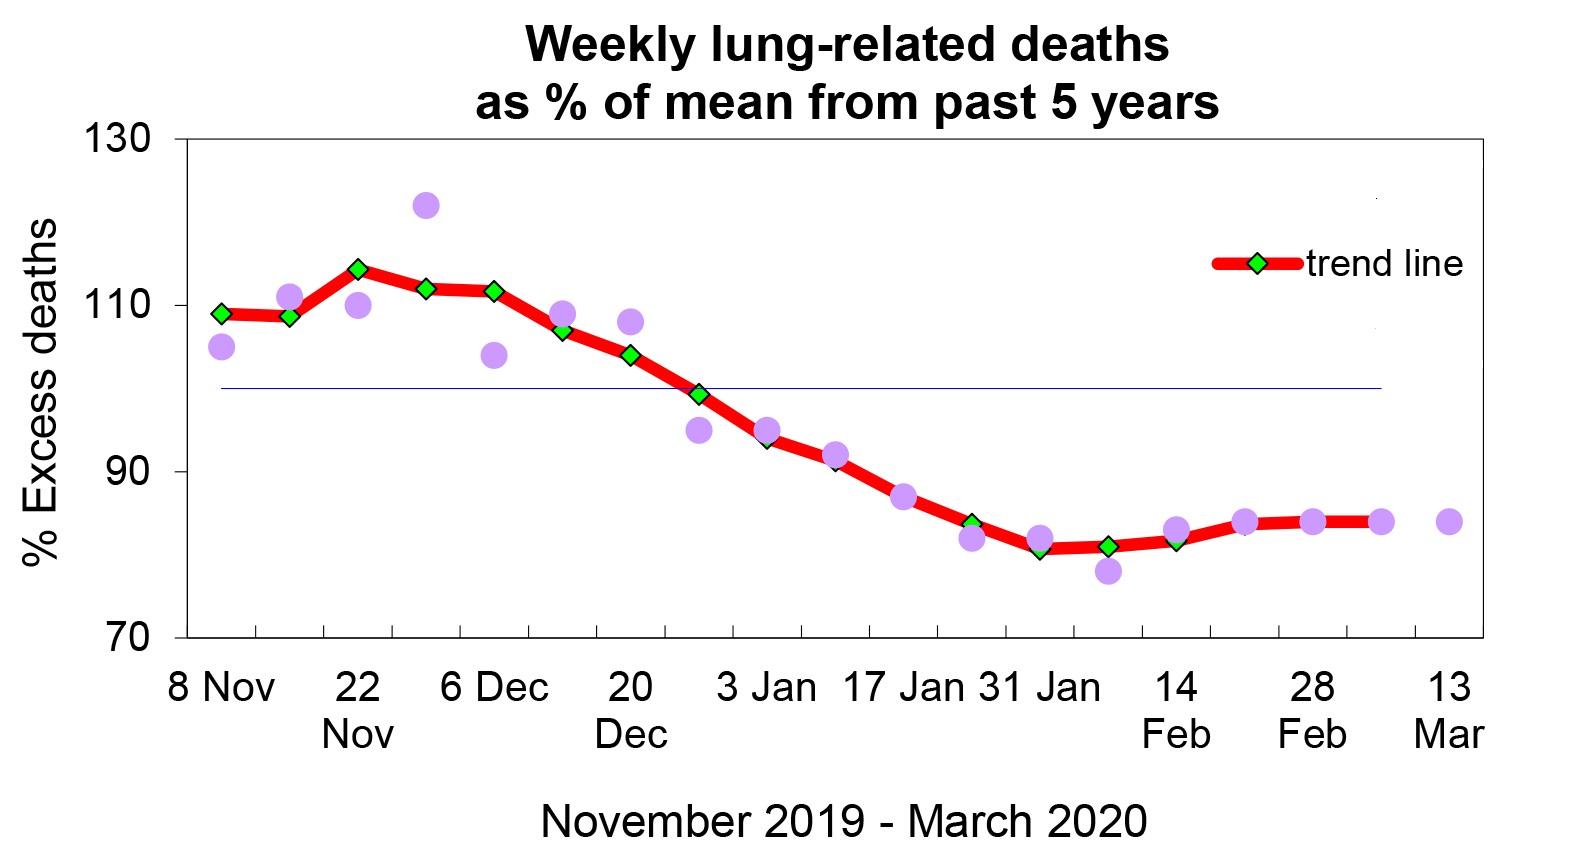
We can view this same data as percentage difference, you might find that helps. Here is, week by week, total lung deaths as a % of the average over the previous 5 years: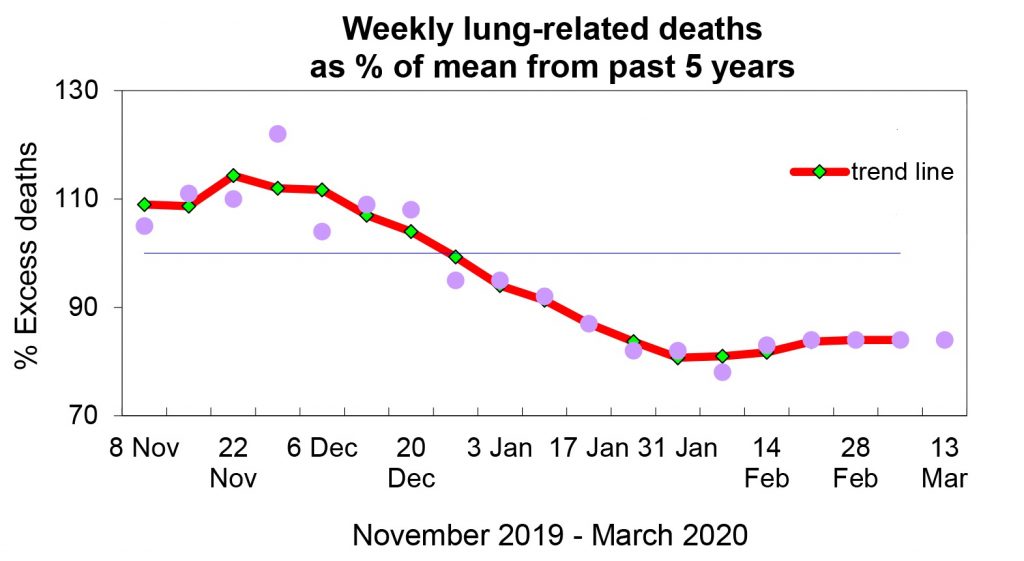
You can see there was some fifteen percent LESS lung-related deaths right thru the supposed deadly onslaught of coronavirus….
This curve is very similar to what we found for total deaths but it’s a larger effect.
Its all a monster hoax. Another one ….